原文信息:
Floating Wind Power in Deep-Sea Area: Life Cycle Assessment of Environmental Impacts
原文链接:
https://www.sciencedirect.com/science/article/pii/S266679242300001X
Highlights
• Environmental impact of a floating wind farm with 100 turbines of 6.7 MW was assessed by LCA method.
• Large-scale floating wind power deployment would not produce higher carbon footprint.
• Steel consumption was the sensitivity factor that affected the LCA assessing results.
• Steel production by electric arc furnace reduced upstream greenhouse gas emissions significantly.
• This study could provide reference value for global large-scale floating wind farm deployment.
摘要
海上漂浮式风力发电作为海上风电行业的一项新兴技术,因其与其他可再生能源合作实现能源系统脱碳的潜力而受到越来越多的关注。应考虑深海漂浮式风电场的环境影响,并设计提高其低碳效应的方法。已经有一些研究评估了海上浮式风电场的环境影响,但这些研究的规模相对较小。本研究基于中国生命周期评价基础数据库(CLCD),使用生命周期评估 (LCA) 方法对有 100 台 6.7 MW 风力涡轮机的浮式风电场所带来的环境影响进行了评估。结果表明,该风电场的碳足迹为25.76 g CO2-eq/kWh,在全球变暖潜能值上相对较低。此外,漂浮式海上风电场对富营养化潜力的贡献最大。钢材消耗量的 ±20% 变化会导致每个环境类别的指标分数呈现 ±3% 至 ±15% 的变化,表明风电场的环境绩效主要受该参数影响。此外,情景分析表明,采用电弧炉炼钢路线,到2030年可减少海上浮式风电场上游过程温室气体累计排放1.75 Mt CO2-eq。钢铁行业的减排将进一步减少漂浮式海上风电场的碳足迹。未来需要收集更多的基线数据,以提高 LCA 的可靠性。漂浮式海上风电场对海洋生态和大气物理特性的影响仍有待深入研究。
https://www.sciencedirect.com/search?pub=Advances%20in%20Applied%20Energy&cid=777797&qs=floating%20wind%20power
Abstract
Floating offshore wind power, an emerging technology in the offshore wind industry, has attracted increasing attention for its potential to cooperate with other renewable energies to decarbonize energy systems. The environmental effects of the floating offshore wind farm in deep-sea areas should be considered, and methods to enhance the low-carbon effect should be devised. There have been a few studies assessing the environmental effects of the floating offshore wind farm, but the scales of these studies were relatively small. This study evaluated the environmental impacts of a floating wind farm with 100 wind turbines of 6.7 MW using life cycle assessment (LCA) method, based on the Chinese core life cycle database. Results showed that the carbon footprint of the wind farm was 25.76 g CO2-eq/kWh, which was relatively low in terms of global warming potential. Additionally, the floating offshore wind farm contributed most to eutrophication potential. A ± 20% variation in steel resulted in a ±3% to ±15% variation in the indicator score of each environmental category, indicating that the environmental performance of the wind farm was mainly influenced by this parameter. Moreover, scenario analysis showed that electric arc furnace routes can reduce the cumulative greenhouse gas emissions from upstream process of the floating offshore wind farm by 1.75 Mt CO2-eq by 2030. Emission reduction of the steel industry will further reduce the carbon footprint of the floating offshore wind farm. In the future, more baseline data need to be collected to improve the reliability of LCA. The effects of the floating offshore wind farm on marine ecology and atmospheric physical characteristics remain to be investigated in depth.
Keywords
Deep-sea area
Offshore wind
Floating wind power
Life cycle assessment
Environmental effects
Greenhouse gas emissions
Graphics
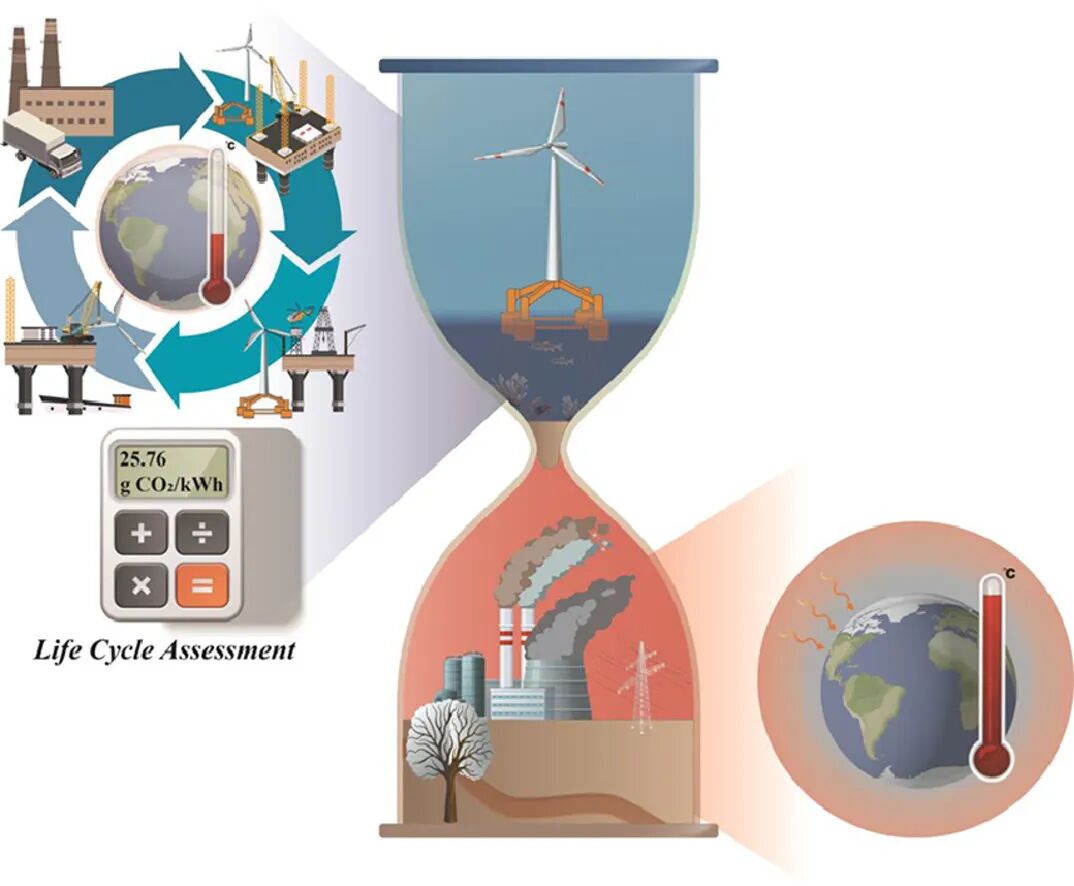
Graphic Abstract
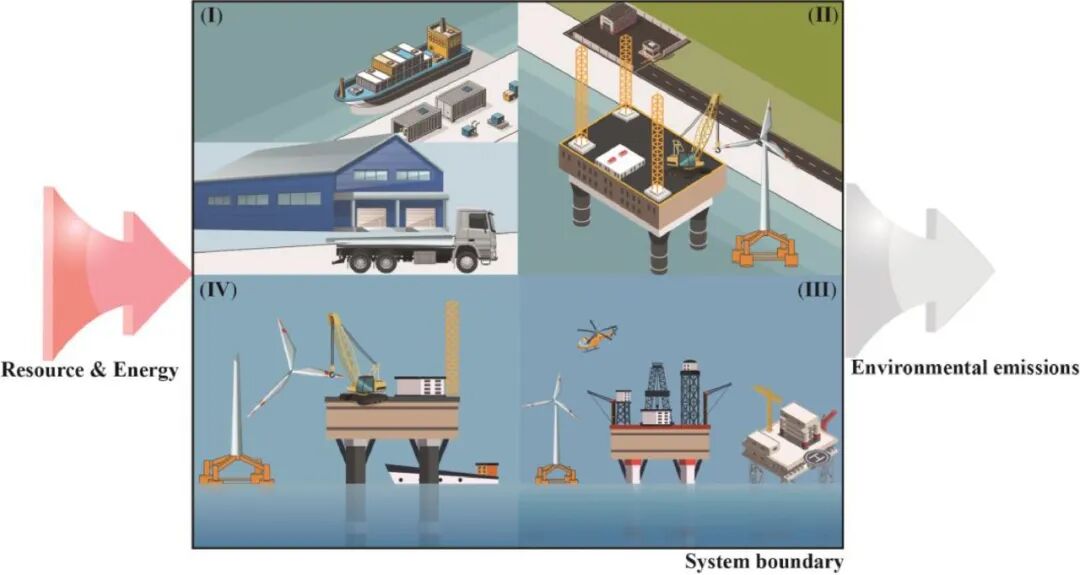
Fig. 3. System boundary of the floating offshore wind power. (I) Components manufacturing and transport, (II) wind farm construction, (III) O&M, and (IV) decommissioning activity.
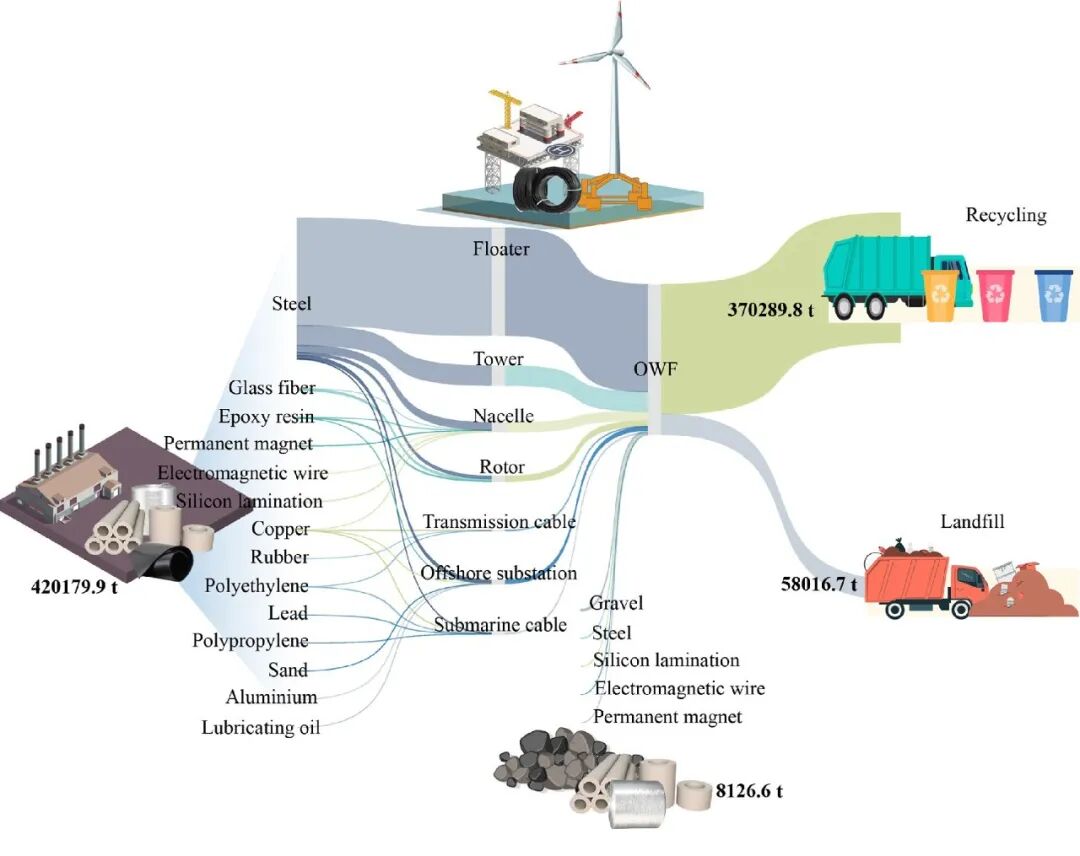
Fig. 4. Material flows of the floating offshore wind farm (OWF) during its lifetime.
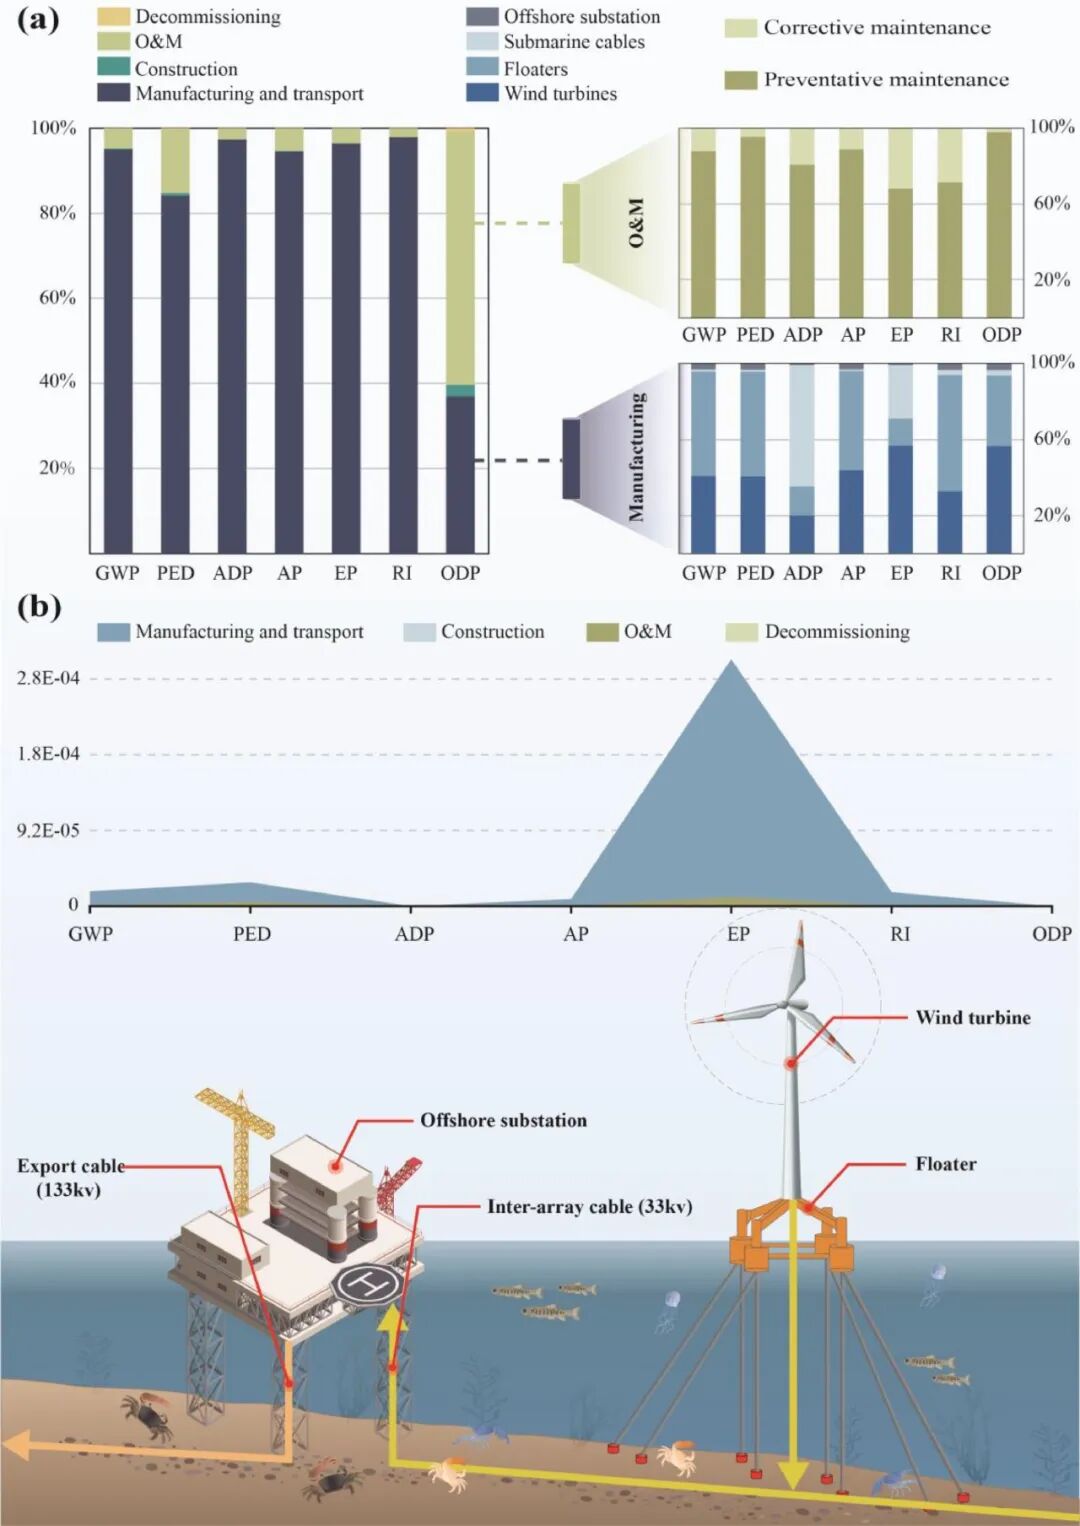
Fig. 5. Life cycle environmental impacts for the baseline case. | (a) Relative contributions of the floating OWF to each impact category in each life cycle stage. (b) Normalized analysis of the LCA results.
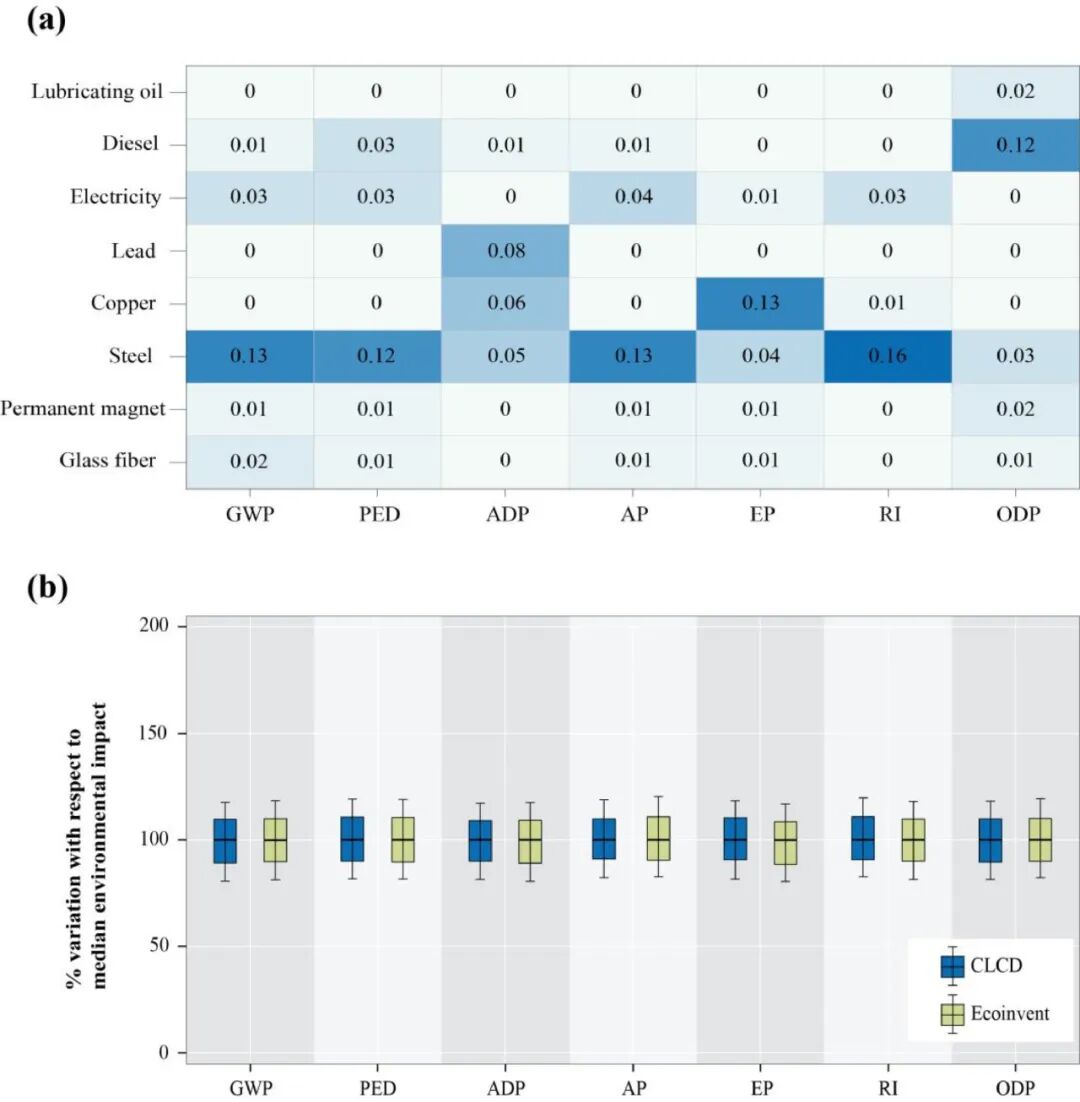
Fig. 6. Sensitivity analysis of the LCA results. | (a) Given the uncertainties of the foreground data, the effects of ±20% variation in input parameters on the LCA results. (b) Statistical distribution of the LCA results in each impact category considering the uncertainties in background data (representing percentiles 2.5, 25, 50, 75, and 97.5, i.e., 95% confidence interval).
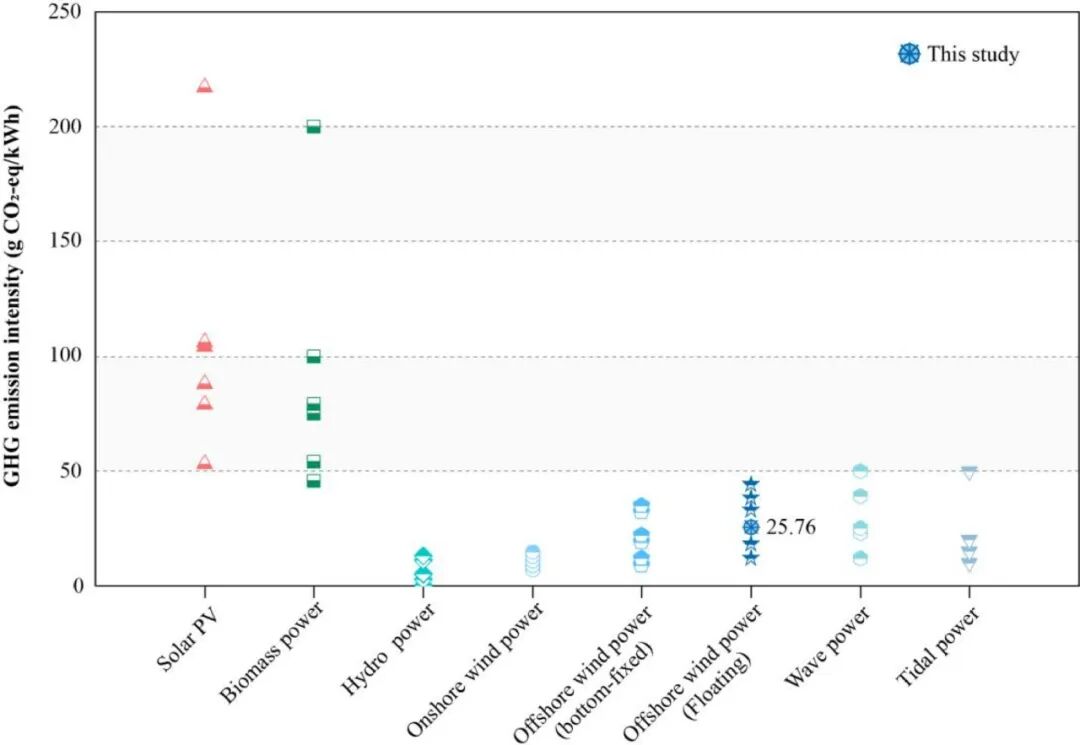
Fig. 7. GHG emissions intensity for different types of renewable energy generation.
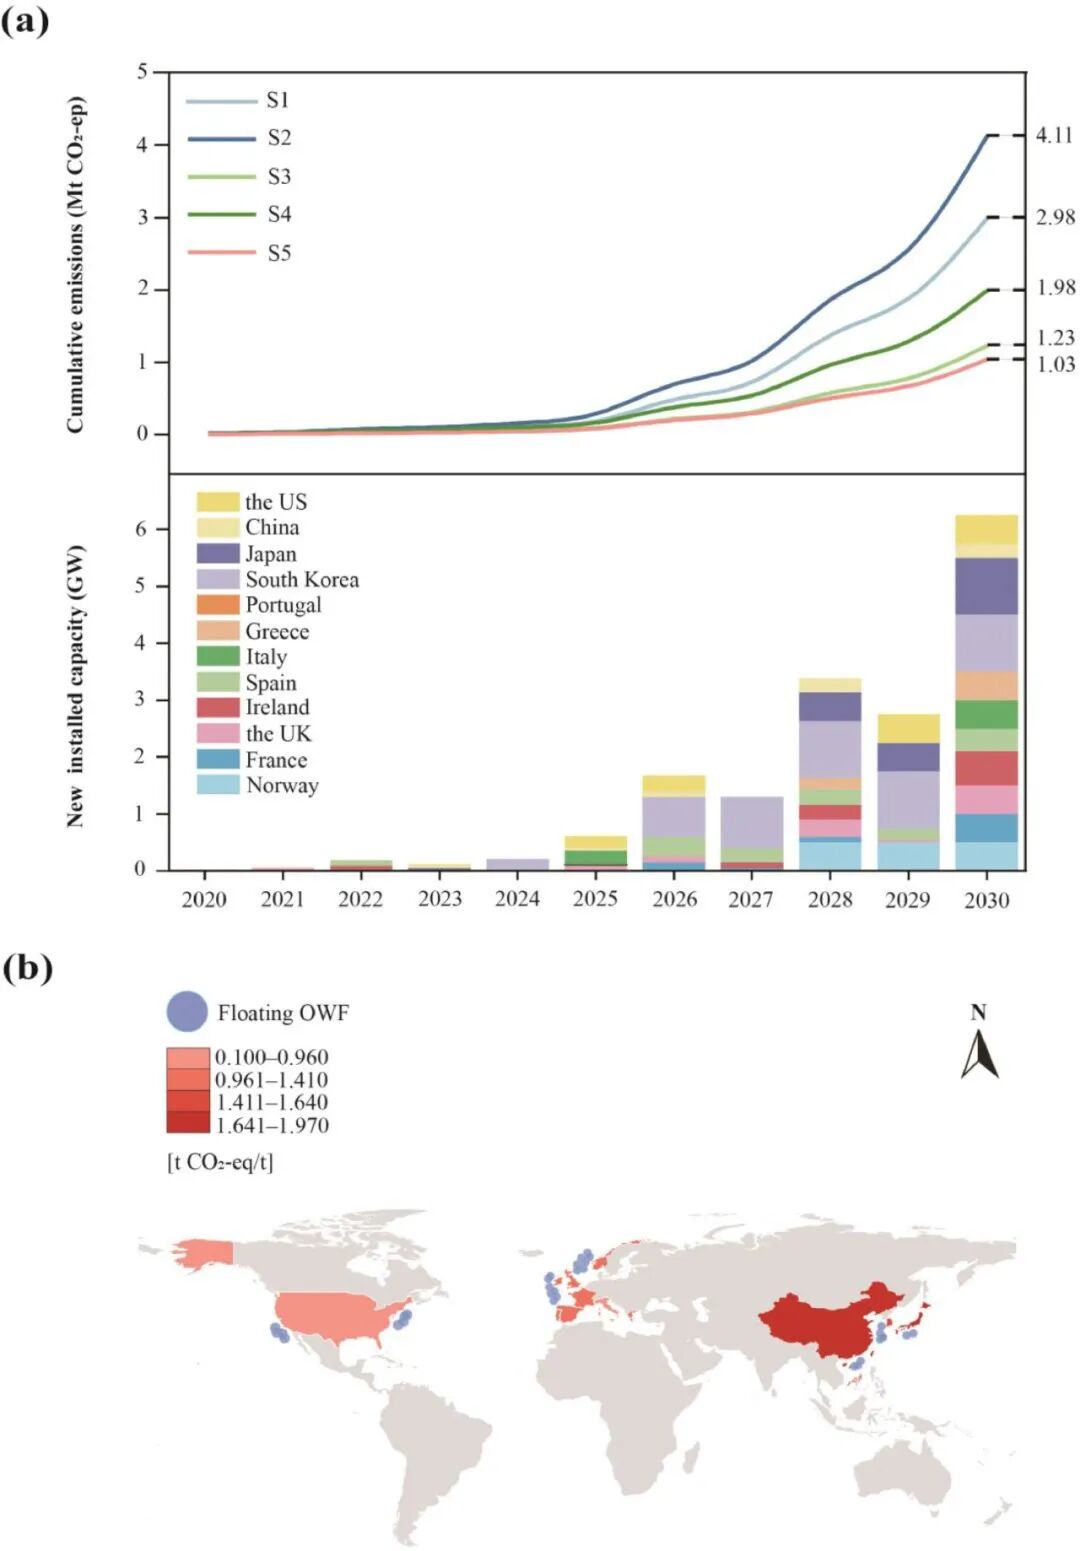
Fig. 8.GHG emissions from global floating wind power deployment for 2020–2030. | (a) Prediction of the cumulative GHG emissions of offshore wind power technology with various steel production routes. The new installed capacity was provided by GWEC’s Global Offshore Wind Report 2021. (b) Average GHG emission intensity of steel production in different countries, where large-scale floating OWFs will be deployed.